

Cascading Slicers
This page contains the following sections:
Conceptual Overview
Cascading Slicers (or "Cascading Prompts") is one of the more powerful features in an analytics tool and allows users to create a "waterfall" effect from one slicer to the next based on their previous selections.
Cascading Slicers are best used when there are large lists that need to be segmented into shorter, clearer choices or when there is huge sparsity in a cube's data, and cascaded values provide a more efficient way to pick relevant values.
Pyramid's cascading slicers are designed around parameters (typically in conjunction with the Advanced Set Designer) which provide a powerful and convenient method for building the prompts WITHOUT WRITING ANY CODE.
There are two ways to build cascading slicers:
- Using the Cascading Slicers Wizard
- Manually, through the Advanced Set Designer and parameters
Cascading Slicer Wizard
Found in the "Analytics" tab in Data Discovery, the wizard enables the user to easily build cascading slicers in two forms:

Click on the lower half of the icon to choose what kind of cascading slicer you would like to build.
Single Hierarchy
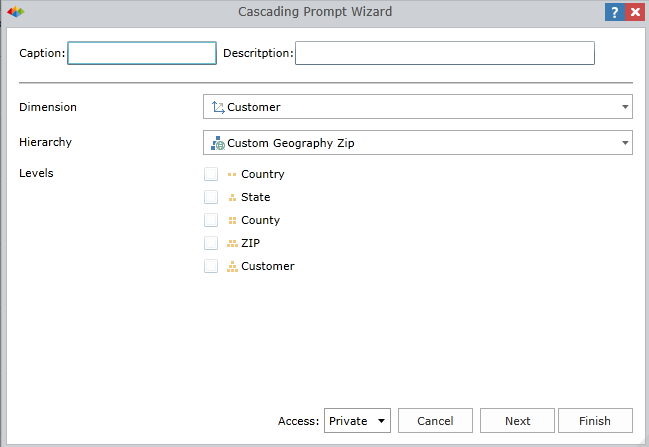
1. Fill in the Caption for the name of the new cascading slicer (and the Description).
2. Select the hierarchy.
NOTE: Only hierarchies with multi levels (otherwise known as user hierarchies) will be available.
3. Select those levels you want included in the cascading slicer.
4. Click the Access button to choose whether this slicer will be for public or private use.
5. Click Next to view the summary of the resulting cascading slicer. Note the names attributed for each level of the cascading slicer (should you choose to not include the whole slicer but only part of it in your report).
6. Click Finish and the new cascading slicer will be available in the custom elements tree.
Multi-Hierarchy
This option allows you to build a cascading slicer through many hierarchies. You can add as many dimensions as you prefer.
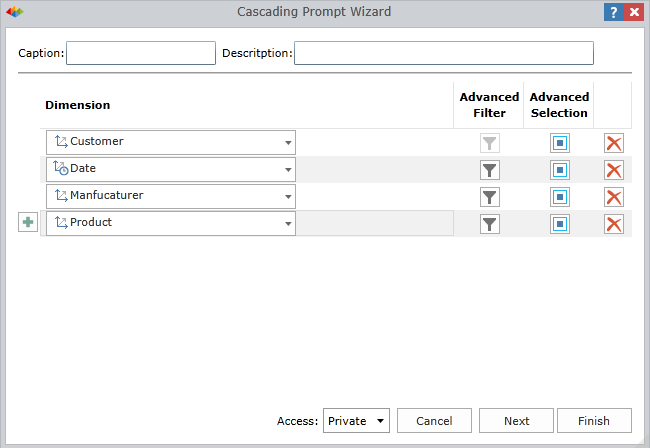
1. Fill in the Caption for the name of the new cascading slicer.
2. Select the Dimension.
NOTE: Every added dimension has default selections. The default selection is to use the NONEMPTY filter with the first user hierarchy, using its second level.
Changing Defaults
3. Select the dimension and click on the relevant Advanced Selection to change from the default selection. A dialog box will be displayed:
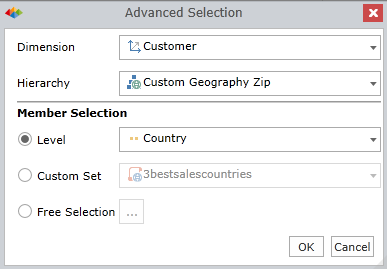
Change the dimension or hierarchy, and then select a custom level or set (or click on Free Selection to make a new selection).
4. Click on Advanced Filter to change from the default selection. A dialog box will be displayed:
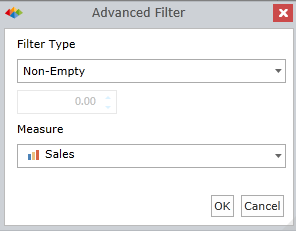
Select the type and corresponding measure.
5. Click the Access button to choose whether this slicer will be public or private use.
6. Click Next to view the summary of the built cascading slicer. You can note the names attributed for each level of the cascading slicer should you choose to not include the whole slicer but only part of it in your report.
7. Click Finish and the new cascading slicer will be available in the custom elements tree.
Manually Building Cascading Slicers
The diagram below explains the general technique using sets that are designed with the advanced set designer.
NOTE: Users can of course write the MDX by hand if they choose (instead of using the ASD).
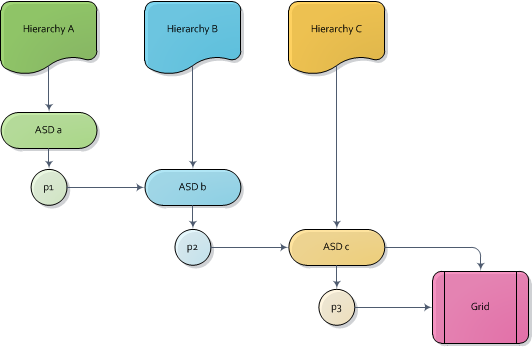
- Create a top level set using the ASD ('a') in the first hierarchy (A).
- In hierarchy A create a new parameter (p1) and use 'ASD a' as the source input for the listing of its elements.
- Now create a new ASD ('b') using the second hierarchy (B). Ensure this ASD uses a NON EMPTY filter, which employs selections from the p1 parameter created in hierarchy A from step 2 above.
- In hierarchy B create a new parameter (p2) and use 'ASD b' from step 3 as the source input for the listing of its elements.
- Now create a new ASD ('c') using the third hierarchy (C). Ensure this ASD uses a NON EMPTY filter, which employs selections from the p2 parameter created in hierarchy B from step 4 above.
- Lastly, either put the final ASD ('c') into the grid as its selections or create another parameter (p3) that feeds yet another hierarchy's ASD (and so on).
When the user deploys the final ASD as either a slice or a selection in the columns or rows, the previous selections that all feed into it will appear as slicers on the report canvas. As a user changes the highest level slice, all subsequent slicers will change accordingly and the result will be visible in the grid.
See Also
Home |
Table of Contents |
Index |
User Community
Pyramid Analytics © 2011-2022